Single Family Home Prices Are Off Big Time in Mountain View’s Waverly Park !
I recently had an inquiry on this Blog’s chat box asking about pricing in the Waverly Park neighborhood of Mountain View. I thought I would give an expanded answer here. Below is a map for the neighborhoods in question (MLS area 208, Waverly Park and the Martens-Carmelita neighborhoods).
View MLS Area 208, Waverly Park Mountain View CA in a larger map
Below are the first quarter statistics detailing the number of new listings and the number of sales of single family homes in the MLS area 208. Sales are down slightly and listings are up (listing numbers are similar to those in 2001-2003).
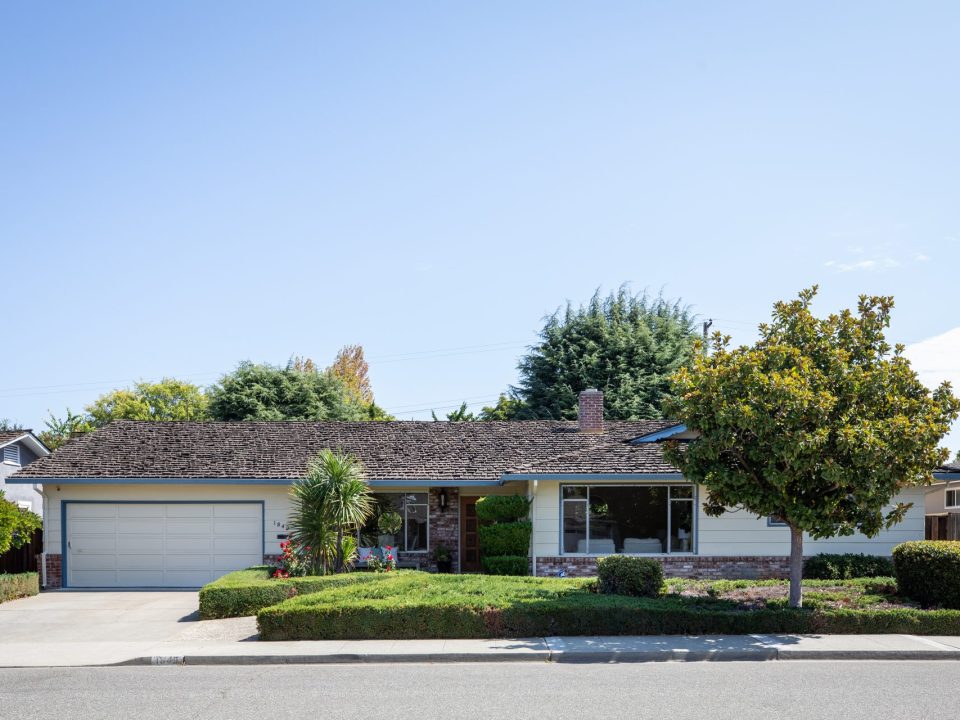
Prices continue to soften and inventory continues to build. 520 Chesley Avenue is an excellent “real life” example documenting the declines in Waverly Park home prices.
According to our local MLS provider, 520 Chesley Avenue was purchased by a local Realtor in March 2008 for $1,537,500. On April 1st, 2009 it came on the market at $1,299,000. It has been on the market for 19 days and is still an active listing. If it were to sell today for it’s list price, it would be a 15% discount from it’s purchase price of a year ago.
Below is a graph that shows the average sales price versus median sales price for the first quarter of each year (since 1998).
The graph shows a 20%+ drop in prices since the (apparent) high in 2007 (also a 15% drop from last year).
The absorption rate of single family homes for sale in Waverly Park is approximately 6 months. The absorption rate is how long it would take, in months, to sell the existing inventory available on the market at the current rate of sale.
What have we learned from all these pretty graphs and data? It is still a strong Buyer’s market!


